The Role of Observability in Modern IT: Logs, Metrics & Tracing Demystified
Poindexters Lab
September 3, 2025
IT Support Insights
In today’s fast-paced digital environment, IT systems are becoming increasingly complex. From cloud-native applications running on Kubernetes to distributed microservices spanning multiple regions, IT teams face the challenge of keeping everything reliable and performant. Traditional monitoring alone is no longer enough—what organizations need is observability.
Observability goes beyond surface-level monitoring. It provides deep insights into how systems behave, why failures happen, and how performance can be optimized. The three pillars of observability—logs, metrics, and traces—work together to give IT teams the visibility they need.
🔍 What is Observability?
Observability is the ability to measure the internal state of a system by examining its outputs. Unlike monitoring, which often focuses on predefined alerts and dashboards, observability enables IT teams to ask new questions on the fly and debug unexpected issues.
Simply put:
Monitoring tells you that something is wrong.
Observability helps you understand why it’s wrong.
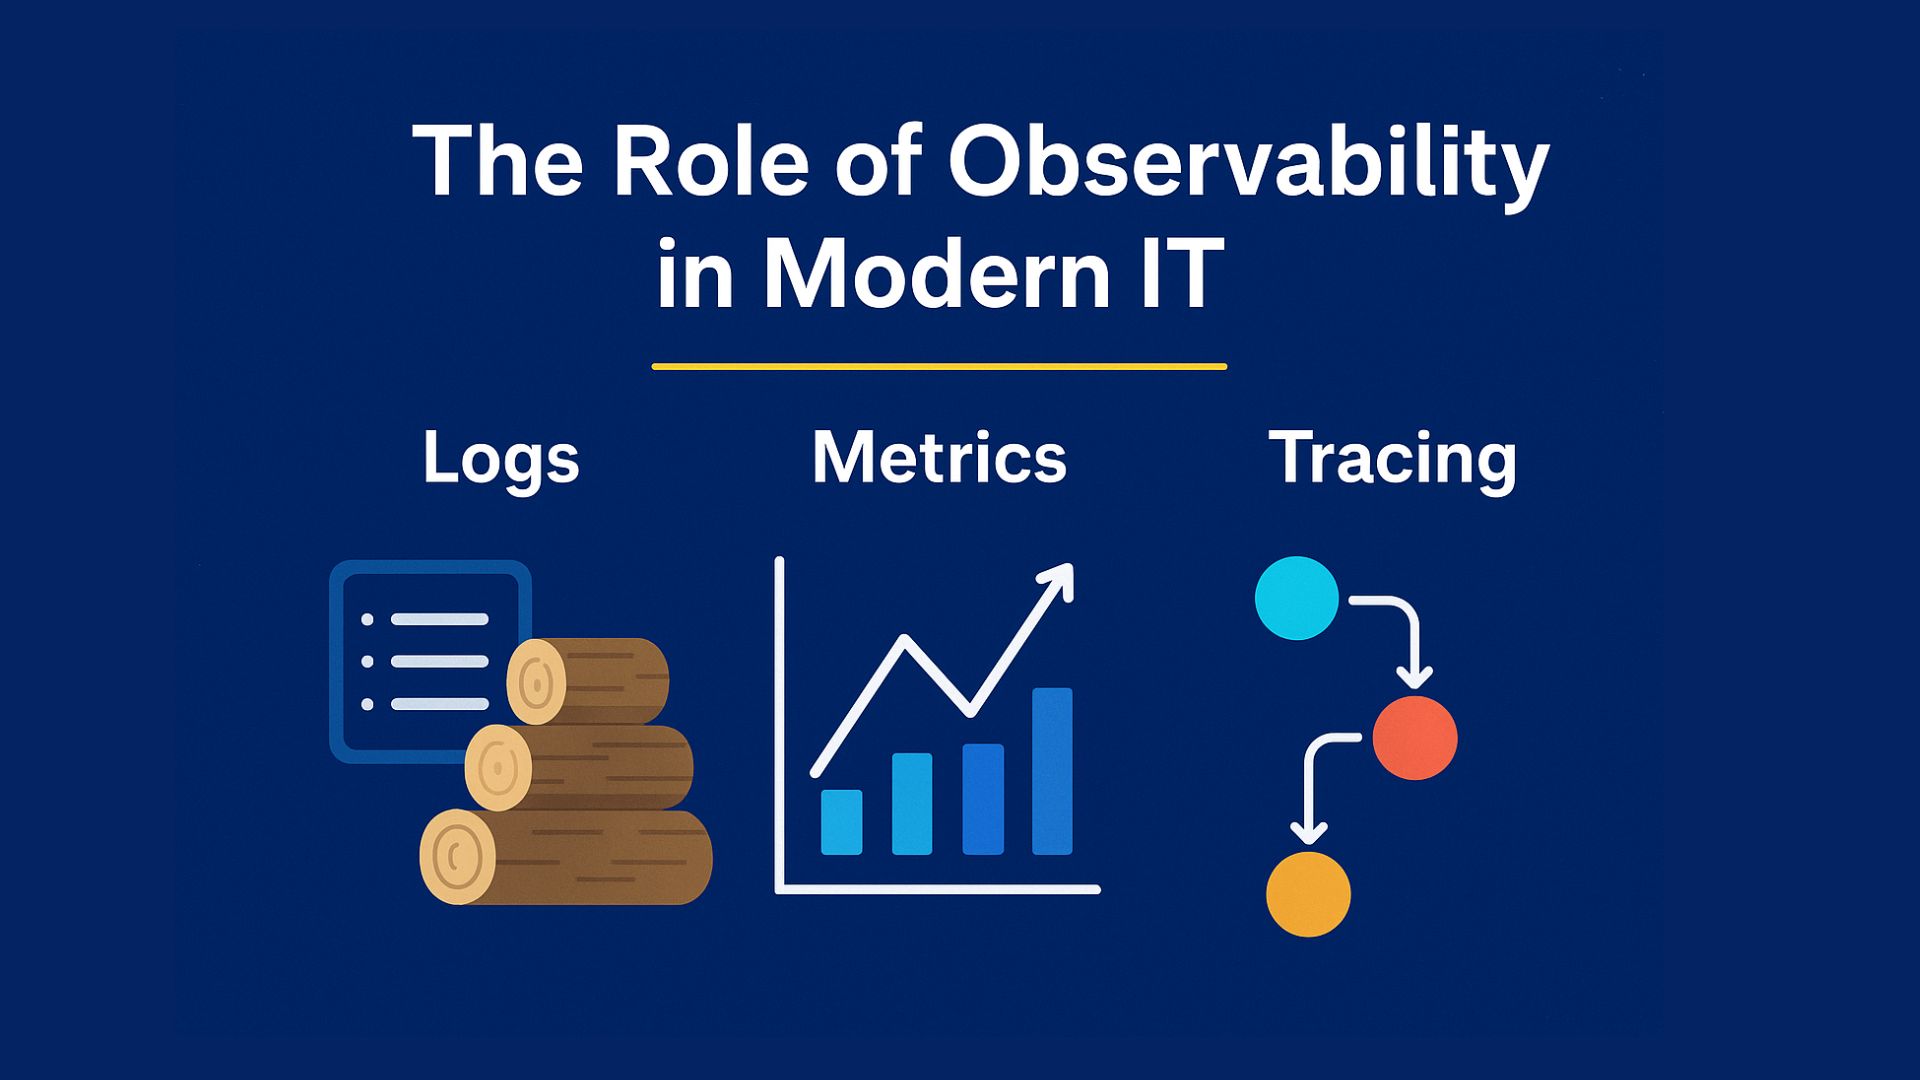
📊 The Three Pillars of Observability
1. Logs
Logs are detailed, time-stamped records of events. They provide context about what happened in your system at a given moment.
Example: An application error log showing a failed database query.
Best practice: Standardize log formats and ensure centralized log aggregation.
2. Metrics
Metrics are numeric measurements captured over time, often aggregated for trends and performance analysis.
Example: CPU usage, request latency, or memory consumption.
Tools: Prometheus, Datadog, CloudWatch.
Best practice: Track key business and system metrics to correlate performance with user experience.
3. Traces
Traces capture the path of a single request as it travels through multiple services in a distributed system. They’re essential for debugging microservices and understanding dependencies.
Example: A user’s login request moving through API Gateway → Authentication Service → Database.
Tools: Jaeger, Zipkin, OpenTelemetry.
Best practice: Implement distributed tracing across all services early in your architecture.
🚀 Why Observability Matters in Modern IT
Faster Incident Response: Pinpoint the root cause of outages quickly.
Proactive Performance Management: Identify bottlenecks before they impact customers.
Improved Collaboration: Dev, Ops, and Security teams share a single source of truth.
Business Impact Visibility: Understand how technical issues affect customer experience and revenue.
🔧 Building an Observability Culture
Implementing observability is not just about tools—it’s about mindset. IT teams should:
Embrace DevOps practices to integrate observability into CI/CD pipelines.
Ensure end-to-end visibility, not just siloed metrics.
Foster a culture of continuous learning and experimentation.
✅ Final Thoughts
As IT ecosystems grow more distributed and complex, observability is no longer optional—it’s essential. By leveraging logs, metrics, and tracing together, organizations gain the visibility they need to deliver reliable, scalable, and customer-focused digital services.
At Poindexters Lab Inc., we help businesses implement observability solutions tailored to their unique infrastructure. Whether you’re running on the cloud, hybrid, or on-premises, our team can guide you in building an observability-first culture.
👉 Ready to demystify your IT environment? Reach out to us today!